Note
Go to the end to download the full example code.
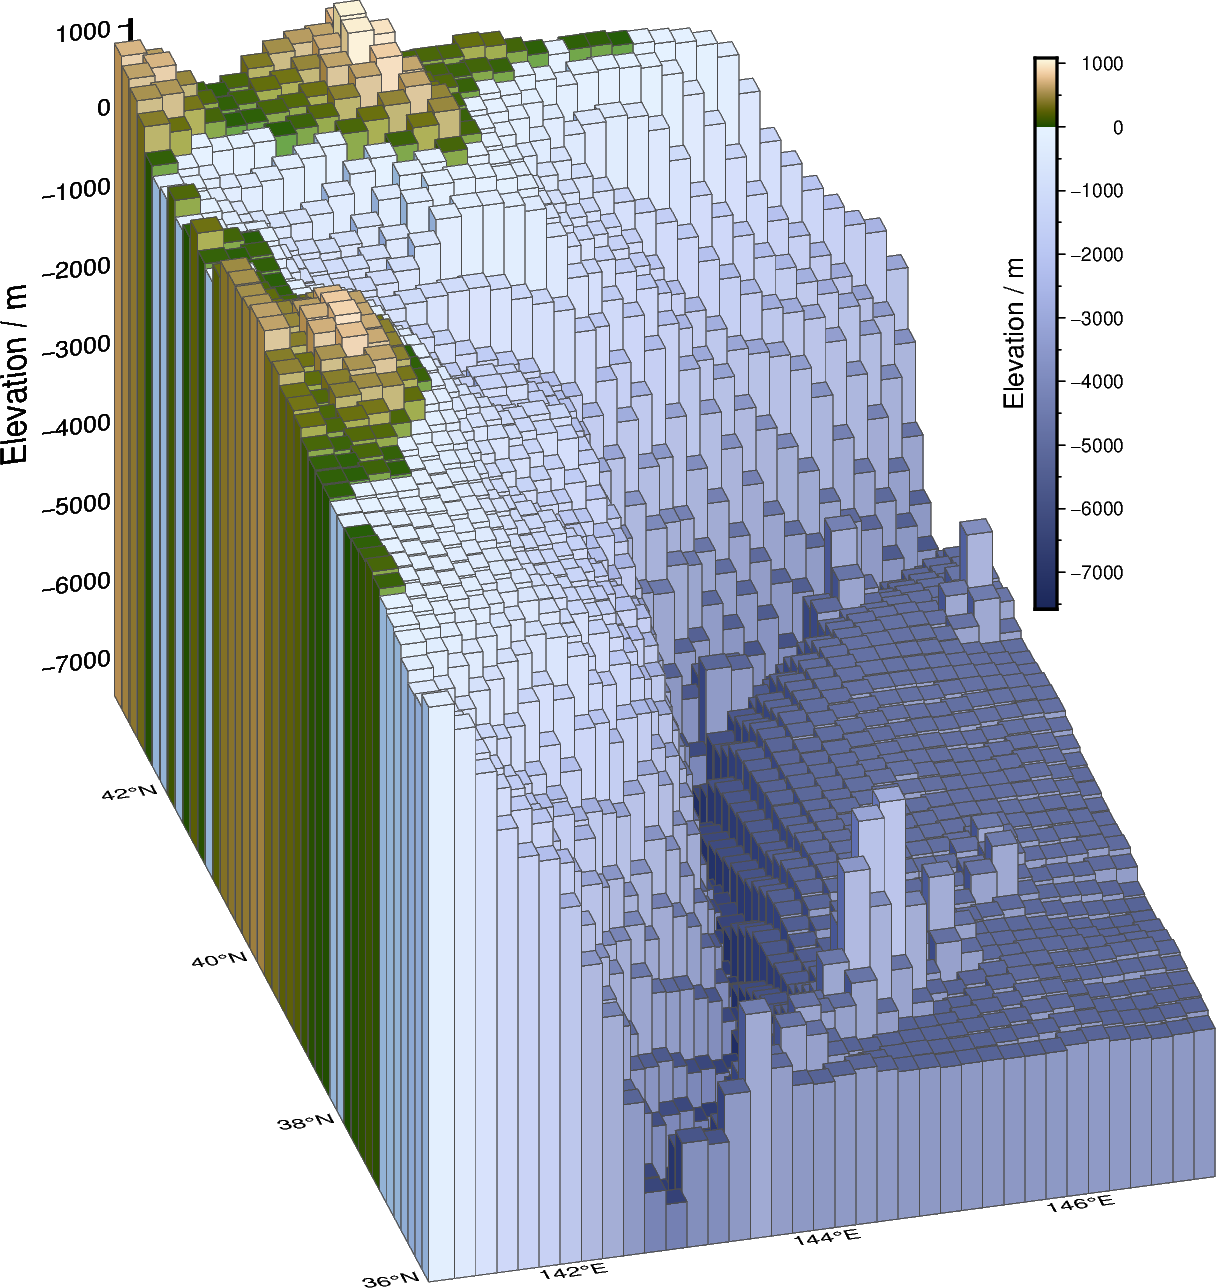
3-D bar plot
Based on GMT EXAMPLE 08
https://docs.generic-mapping-tools.org/6.6/gallery/ex08.html
Convert grid to table: pygmt.grd2xyz
Plot in 3-D via bars: meth:pygmt.Figure.plot3d
import pygmt

region = [141, 147, 36, 43]
grd2tab = pygmt.grd2xyz("@earth_relief_10m", region=region)
grd2tab["color"] = grd2tab["z"]
z_min = grd2tab["z"].min() - 50
z_max = grd2tab["z"].max() + 50

fig = pygmt.Figure()

fig.basemap(
    region=[*region, z_min, z_max],
    projection="M10c",
    zsize="10c",
    perspective=[195, 30],
    frame=["WSneZ", "xaf", "yag", "za1000f500+lElevation / m"],
)

pygmt.makecpt(cmap="SCM/oleron", series=[z_min, z_max])
fig.plot3d(
    data=grd2tab,
    cmap=True,
    pen="0.01p,gray30",
    style=f"o0.34c+b{z_min}",  # bars o, base +b
    perspective=True,
)
fig.colorbar(frame="xa1000f500+lElevation / m", position="jTR+o1.8c+v+w7c+ml")

fig.show()
Total running time of the script: (0 minutes 0.849 seconds)